비주얼 스튜디오에서 assembly code를 생성하는 것이다.
| 1. Menu -> Build -> Set Activie Project Configuration -> Win32 Release 선택 2. Menu -> Project -> C/C++ tab -> Category : General -> Optimizations : Customize -> OK 3. Menu -> Project -> C/C++ tab -> Category : Listing Files -> OK 4. Compile 5. See the Release folder 6. Open XX.asm 7. Enjoy |
다음과 같이 코드를 작성 했을 경우
|
#include<stdio.h> int MyCalc(int a) int main(void) return 0; |
다음과 같은 assembly code를 얻을 수 있다.
|
TITLE C:\MyTest\MyTest.c ; 4 : { push ebp ; 5 : return a * a; mov eax, DWORD PTR _a$[ebp] ; 6 : } pop ebp ; 9 : { push ebp ; 10 : int val = 23; mov DWORD PTR _val$[ebp], 23 ; 00000017H ; 11 : MyCalc(val); mov eax, DWORD PTR _val$[ebp] ; 12 : xor eax, eax ; 14 : } mov esp, ebp |
이상 내가 알고 있는 방법이다. 아래는 다른 사람들 혹은 외국인들의 방식이니 참고 하기 바란다.
+
Assembly를 잘 알지도 하지도 못하지만, 보고 싶을 때가 많다.
내가 짠 코드가 얼마나 최적화 되었는지 말이지...
Linux에서 작업할 때는 objdump 라는 좋은 툴이 있는데, Visual Studio에서 방법이 없나 궁금했다.
근데 의외로 아~주 쉽게 발견!
Properties -> C/C++ -> Output Files에서 Assembler Output 이란 부분이 있는데 여기는 default로 No Listing이다. 이것을 바꿔주면, cod 파일로 Output files가 생성되는 위치에 같이 생성되는데 이 파일이 바로 Assembly code !
출처 : http://blog.naver.com/songhl3?Redirect=Log&logNo=80041977144
+
[an error occurred while processing this directive]
Guide to Using Assembly in Visual Studio .NET
This tutorial explains how to use assembly code in a Visual Studio .NET project. It covers adding assembly code to a project containing a main() function in C and debugging a project with assembly.
Creating a C/Assembly Project
The project we'll develop in this tutorial will consist of a main() function written in C. It will call an assembly function named clear(). Since Visual Studio does not recognize assembly code, Visual Studio will have to be told what program to call to compile the assembly code. In this section, we'll cover the basic steps of creating a project, adding assembly code to it, specifying the Custom Build instructions, and building the project.
Step 1 - Create Project
Create a standard Visual Studio .NET 2003 C++ project. You should do the same things you have been doing to create solutions: Create a new blank solution, a Visual C++ project, and scroll down to select a win32 console application. On application settings be sure to make it an empty project.
Add a C source file with a main() function. For this tutorial, we will create a main() function that will call an assembler function named clear() of type void and requires no parameters. We will define clear() using assembly code in a separate file called clear.asm. Since it is in a separate file, clear() will need to be declared at the beginning of the file. Our main() function will look like this:
  extern void clear();

  int main() {
     clear();
     return 1;
  }
C++ Compiler Note: If you are using a C++ compiler, it will mangle names of functions. To avoid this, use
   extern "C" {
      void clear();
   }
(Thanks to Gabriel Zabusek for this note.)
Step 2 - Add Assembly Code
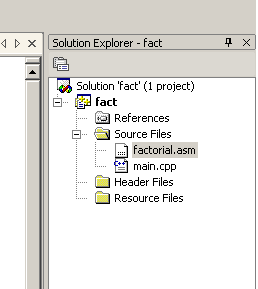
You can add files you have created (both .c and .asm) to the source files by right clicking on the source files folder in the solution explorer and selecting add existing item. After adding both files to the source files the solution explorer should look like:
Add the file that contains your assembly source code to the project. If this hasn't been created yet, you can do this by selecting FileView in the Project Window, right-clicking on the project's name and selecting "Add files to project..." When the dialog box appears, type in the name you want the assembly code file to be saved as (in our case, clear.asm). VS will warn you that the file does not exist and ask if you want to create a reference to it in the project anyway. Select Yes. Expand the tree listing in the project window until you see the name of the assembly file (clear.asm). Double-click the file name. VS will ask if you want to create a new file with that name. Select Yes. A new file will be created and opened in the editor.
Enter your assembly code. For this tutorial, we will clear the EAX and EBX registers. To do this, we'll use this code:
.586              ;Target processor.  Use instructions for Pentium class machines
.MODEL FLAT, C    ;Use the flat memory model. Use C calling conventions
.STACK            ;Define a stack segment of 1KB (Not required for this example)
.DATA             ;Create a near data segment.  Local variables are declared after
                  ;this directive (Not required for this example)
.CODE             ;Indicates the start of a code segment.

clear PROC
   xor eax, eax
   xor ebx, ebx
   ret
clear ENDP
END
Step 3 - Set Custom Build Commands
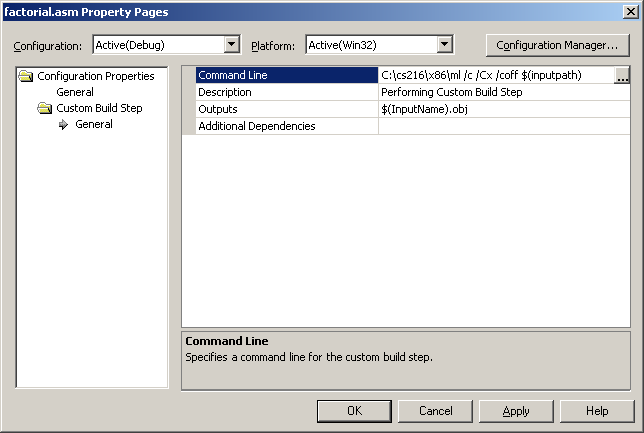
We now provide the commands that VS will use to compile the assembly code. VS does not compile assembly source code. It must call an external program named ml.exe to perform the compilation. The command line must be added to Custom Build options of the Project Settings. To do this, right-click on the assembly filename (in the picture below, this is factorial.asm) in the Project window. Select Properties... from the pop-up menu.
Select the Custom Build Step folder and update the a) Command Line and b) Outputs fields:
The Command Line field. This is the actual command which will be executed to build the file factorial.asm. It requires running ml.exe (the assembler) on your input file. You need to be sure that the first part of the command actually is where you have downloaded the ml.exe file (you don't need to add the .exe extension). The following will work if you had the file ml.exe in the directory C:\cs216\x86:C:\cs216\x86\ml /c /Cx /coff $(inputpath)(Note that if your directory name includes any spaces, you need to enclose it in quotation marks.)
The Outputs field. This proves the name of the file created by the build step. In this case it will be the name of the input file with an .obj file extension.
After setting these two fields, hit OK and close the dialog box, and you should be ready to build.
Step 4 - Compile and Link
The project may now be compiled, linked, and run like any other VS project. Press F7 to Build the project and F5 to execute the program.
Debugging a C/Assembly Project
Debugging a program with assembly is a little more involved than debugging a pure C program. In particular, Step-Into (F11) will not descend into an assembly module. We must use the Disassembly Window to get around this limitation. To debug the assembly code, we will have to stop the program with a breakpoint, open the disassembly window to view the assembly code, open the register or the memory windows, and use F11 to step through the code in the disassembly window.
Step 1 - Stop the Program
Place a breakpoint on the line of your code that calls the assembly routine. Run the main program by pressing F5 (Go). It will execute normally and stop when it hits the breakpoint.
Step 2 - Open the Disassembly Window
Open the Disassembly Window by selecting Debug->Windows->Disassembly from the Debug menu (these menu options probably won't appear until you have run the program). You can also view the disassembly by right clicking on the C code and selecting Go To Disassembly. A new window will appear that should look like this:
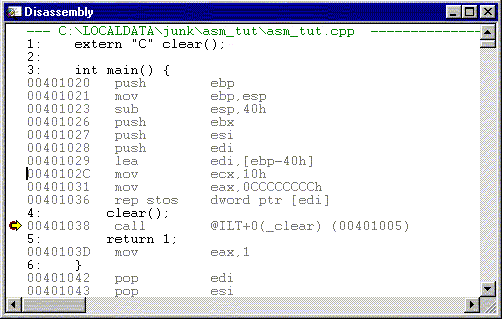
The Disassembly Window shows the object file assembly instructions. The actual C code we wrote is listed in black. The disassembled code is listed in grey after corresponding C statement. These are the actual assembly instructions which will be executed as the program is run. The yellow arrow, indicating the next instruction to be executed, is present in this window. The arrow, however, is not pointing to the C statement clear();, but rather to the assembly instruction 00401038 call @ILT+0(_clear) (00401005).
The Disassembly Window allows stepping through code one assembly instruction at a time.
Step 3 - Display Registers and Memory
You may want to open the Register and Memory Windows at this point. These windows provide a snapshot of what's in the CPU's registers and system's memory between execution of program instructions. Open the Register Window by selecting Debug->Windows->Registers from the Debug menu (these menu options probably won't appear until you have run the program). It should appear like this:
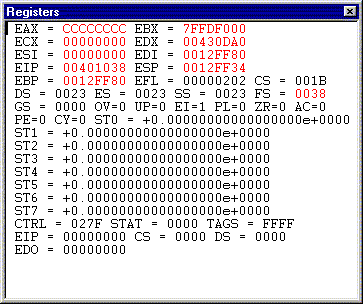
You can see the register values for EAX, EBX, ECX, EDX, ESI, EDI, ESP, and EBP, as well as some other registers and status flags present in the processor (these registers are from a Pentium Pro; registers in other processors may be different although the 8 listed will be present). You can right click in the register window to select which registers (FP, MMX, etc.) will be displayed.
To examine memory, select Debug->Windows->Registers from the Debug menu (these menu options probably won't appear until you have run the program). It appears like this:
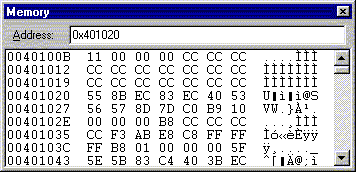
It provides a memory dump with the memory address on the left, the hexadecimal values of the memory contents on the right, and the ASCII representation of the hex values on the right. A particular memory location can be displayed by typing the address in the text box at the top of the window. The window shown above displays the beginning of our program. The first instruction is in memory location 0x00401020 and is 0x55. This is the hexadecimal encoding of 'push ebp'. The next six numbers on the line show subsequent memory locations. In this example, a total of seven memory locations is shown on each line in this window. Note that the window can be re-sized to change the number of bytes displayed per line. The final column is the ASCII characters for the memory locations. This will usually be garbage unless you are viewing a memory region that has text stored in it. You can right click in the memory window and adjust how the contents of memory are grouped (by 1, 2, 4, or 8 bytes) and displayed (as signed or unsigned integers, floating point numbers, hex, etc.).
Step 4 - Step through the Code
Single-step through the code using F10 (Step Over) and F11 (Step Into). The Disassembly Window will trace execution of assembly instructions with the yellow arrow pointing to the next instruction to be executed.
Pressing F11 once executes the call instruction. We're now at a jmp instruction that will jump us to beginning of the clear() function. Pressing F11 again takes us to the first instruction of the clear() function. The Disassembly Window now looks like this:
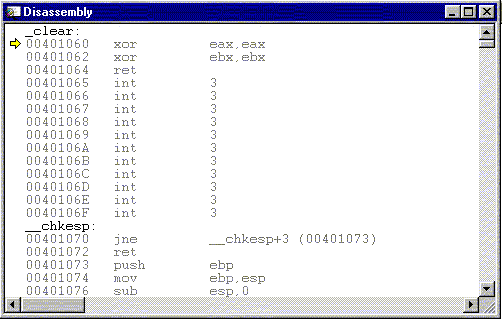
Notice that the yellow arrow is pointing to the first of our two xor calls. The Registers window at this point is unchanged. Pressing the F11 key again executes the first xor statement, clearing the EAX register. The Registers window is now:
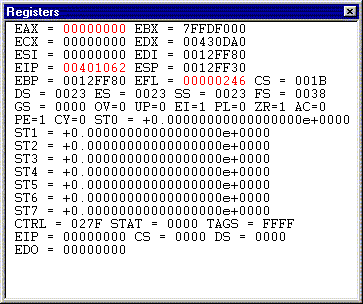
The EAX value is now 0x0. Pressing F11 again clears the EBX register. Pressing F11 again returns from the clear() function and places us below our C statement return 1;. Since we've finished debugging the crucial part of our code, we can press F5 to Go and quickly finish the program.
[an error occurred while processing this directive]
출처 : http://www.cs.virginia.edu/~evans/cs216/guides/vsasm.html